How many weeks a split test needs
Enter daily visitors, the conversion rate you have now, and the lift you want the test to detect.
A winner called on day three can still be noise. How long an A/B test should run depends on the sample size you set before launch. Collect that many visitors on each variant, then divide by the traffic the page gets each day.
The count uses the conversion rate you have now, the lift you want to detect, and the confidence level and statistical power you choose below. The usual plan is 95% confidence and 80% power, the power level Evan Miller says practitioners typically set. Divide the visitors both sides need by daily traffic and round up to whole weeks.
Landing page split test calculator
Two variants, half the traffic each. A third variant needs more visitors than this form will show.
The figures for the entries above appear here.
The sample size formula
An A/B test sample size calculator is this equation, with your rate and your lift filled in.
Four inputs set the count. The baseline conversion rate is the share of visitors who convert on the page today. The minimum detectable effect is how much higher the variant has to convert, as a fraction of the rate you already have. Significance and power sit in the optional settings under the form. At the default confidence level, the two-sided test uses α = 0.05. Power, written 1 − β, is the chance you catch a lift that is really there. Those two settings are already filled in.
The test is a two-sided two-proportion z-test, with traffic split evenly. The count for one side is:
n = ( z_a * sqrt(2 * p_bar * (1 - p_bar)) + z_b * sqrt(p1 * (1 - p1) + p2 * (1 - p2)) )^2 / (p2 - p1)^2
p_bar = (p1 + p2) / 2
p1 is the current rate. p2 is the rate the variant has to reach. p_bar is their average. z_a is the normal quantile for the confidence you picked, and z_b is the quantile for the power. Evan Miller's rule of thumb starts from the same ingredients, variance p(1 − p) and the lift you are willing to miss.
Optimizely's planning note walks through a different case: a 15% baseline, 95% significance and a 10% relative lift, which they put at about 8,000 visitors per variation. That figure belongs to that example.
A worked landing-page case
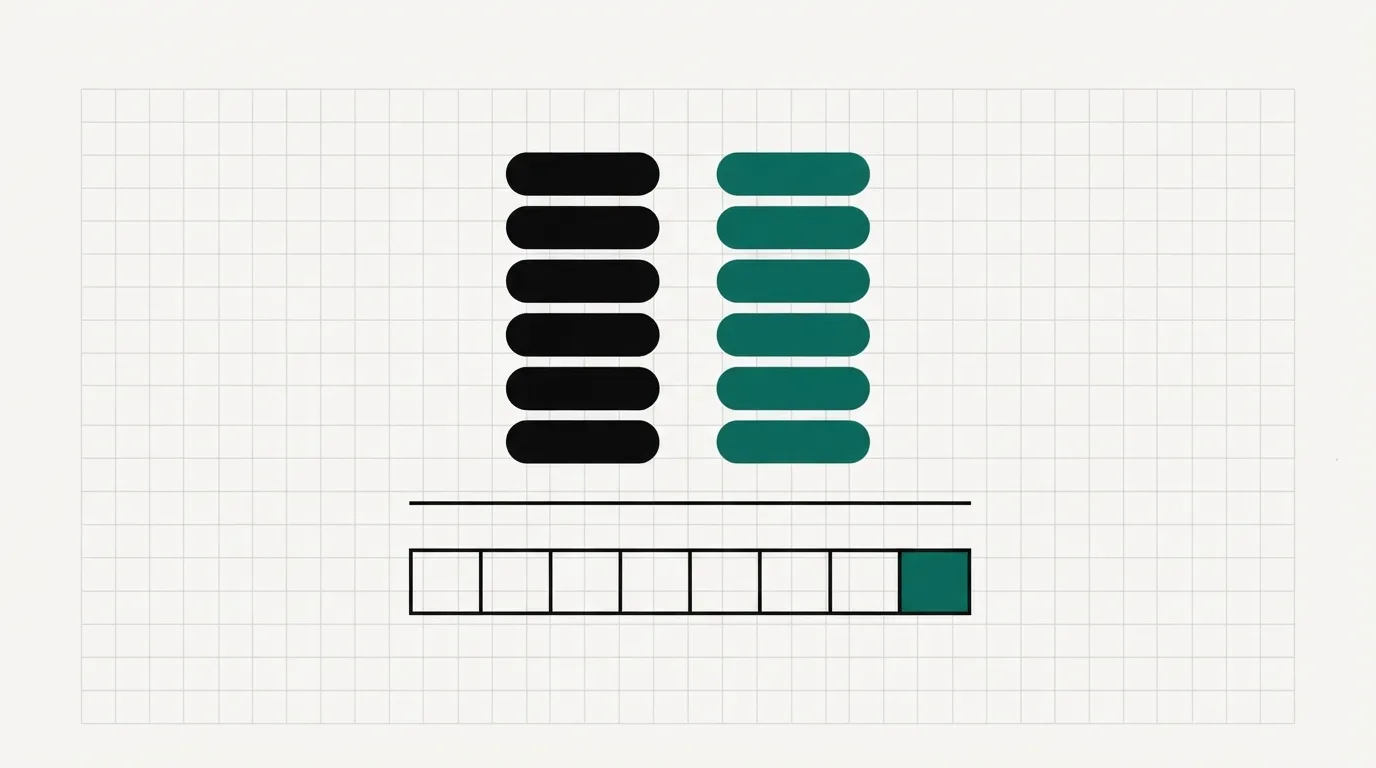
Take a page converting at 3%, and a test aimed at a 20% relative lift. A 20% relative lift moves a 3% page to 3.6%, not to 23%. With the defaults above, and traffic split evenly, each side needs 13,914 visitors. Both sides together need 27,828.
At 500 visitors a day, that collection takes 56 days, so the plan is 8 full weeks. The figure is how long it takes to gather the sample. It does not promise a winner. A holiday week, or a shift in where the clicks come from, can slow the count.
How long beyond the math
The sample can fill on a Tuesday. The decision still waits for a full set of weekdays.
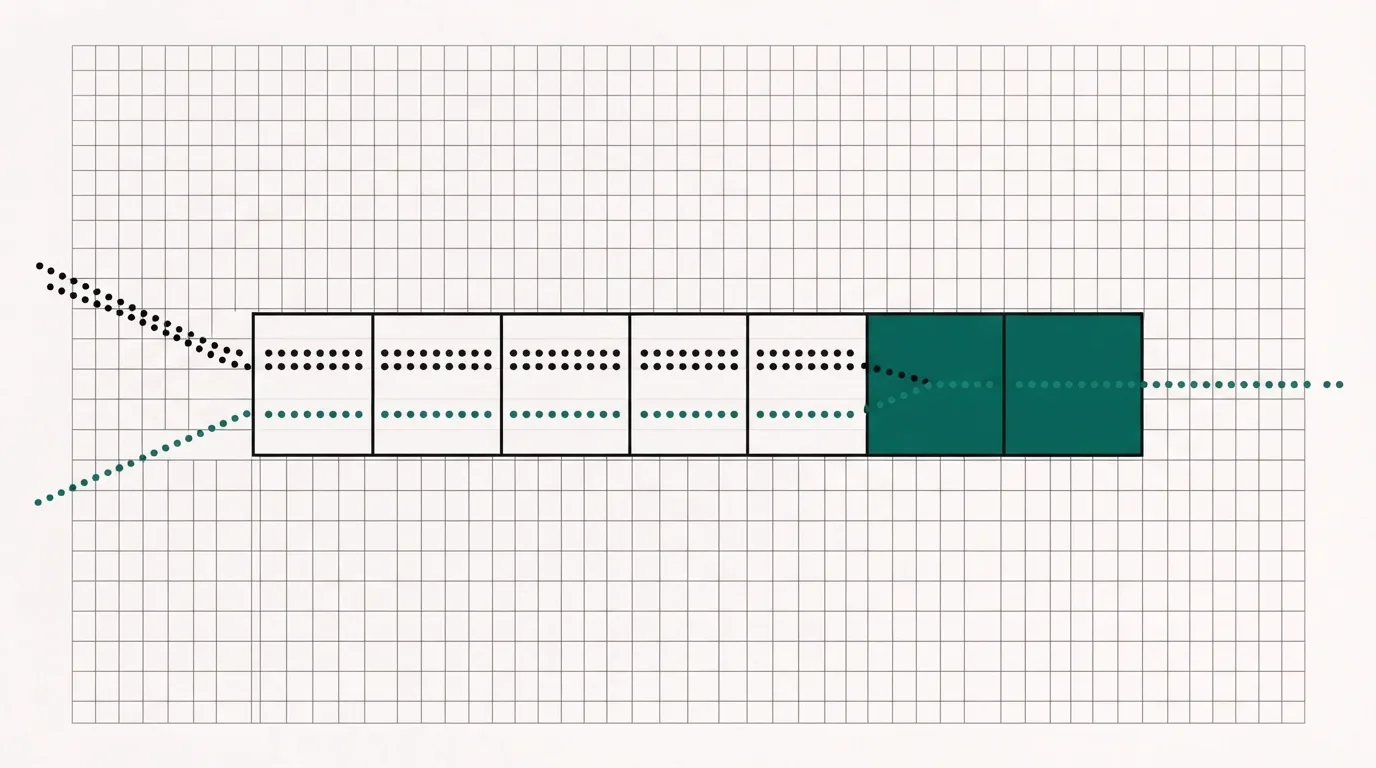
Optimizely recommends a minimum of one business cycle, seven days, so weekday and weekend behavior both appear in every variant. Nielsen Norman Group recommends at least one to two weeks, even if you already have enough visitors for the sample, because people behave differently on different days of the week. The form takes the longer of the traffic math and seven days, then rounds up to whole weeks.
The same vendor will not call a winner on a binary metric until the variation and the baseline each have at least 100 visitors and 25 conversions. That is a gate on their dashboard. It does not stand in for the power calculation above.
End the test when the pre-planned count is in. A p-value under 0.05 before that point inflates false winners, which is why the runtime is fixed at the start.
When your traffic cannot finish a test
Paid-media buyers treat a short run as useful only when volume is already high. Under about a thousand conversions a month, a small copy test is too thin for a formal winner, and some of those teams skip the test and ship a larger redesign. Startup sites under a few thousand monthly uniques report the same wait on a headline change.
If the required sample takes months to reach, widen the lift you are willing to detect, test a bigger change, or wait for more visitors. I would not hold a headline test that the form puts at several months. I would ship a larger redesign, which is what those low-traffic teams describe doing when a small copy test cannot finish, or I would wait until the page has more visitors.
Where you run the split test
The week count only helps if the plan includes testing and can hold the traffic for the whole run.
Unbounce includes unlimited A/B testing from the Experiment plan, $149 a month on the list price or $112 a month billed annually, with a cap of 30,000 unique visitors a month. Starter and Build have no A/B testing. On Unbounce's pricing page a visitor counts once per month, by cookie, for each landing page, popup or sticky bar, and that count goes toward the cap.
Leadpages includes manual A/B testing on Grow, $67 a month on the annual plan card, and does not cap traffic. Pro and Business are publish-only and have no A/B testing. The tiers are on Leadpages' pricing page.
If the daily visitors you enter would take a capped plan over its monthly limit before the weeks are up, the runtime and the plan limit do not fit together. Price the plan you would actually be on with the funnel tool cost calculator. Leadpages vs Unbounce sets the two side by side on testing and traffic. The six-question picker matches a builder to what you sell and how you get traffic. We rank split-testing tools separately on the best-of hub. How this site reads vendor pages and user reports is on the methodology page.
Frequently asked questions
How many visitors does each variant need?
How long should an A/B test run at a few hundred visitors a day?
Does raising confidence from the default make the test longer?
What does relative lift mean?
Is 1,000 visitors enough to call a winner?
Can I stop when the dashboard looks significant?
What we read
Other sources
8 discussions and reviews read for this page. Quotes are excerpts; open a link to read the original in context.
- [em-power] Evan Miller: the low base rate problem
- [em-rule] Evan Miller: how not to run an A/B test
- [opt-long] Optimizely: how long to run an experiment
- [opt-sig] Optimizely: statistical significance
- [opt-mde] Optimizely: minimum detectable effect
- [nng] Nielsen Norman Group: A/B testing
- [ub] Unbounce pricing
- [lp] Leadpages pricing
Related
- Best funnel and landing page tools
- Funnel tool cost calculator
- Six-question funnel tool picker
- Unbounce pricing and visitor caps
- Leadpages pricing
- Leadpages vs Unbounce on testing and traffic
- How Funnel Critic researches tools

Written by
Marta Ovalle
Editor, funnel & checkout tools
Marta Ovalle leads Funnel Critic's coverage of funnel builders and checkout platforms. She reads the long-running threads where operators compare tools after months of live ad spend, cross-checks every claim against the vendor's own docs and pricing pages, and confirms prices with each vendor before a verdict goes live. She writes most of the roundups and pricing pages, and she decides when a ranking changes.